Year :
1993
Title :
Mathematics (Core)
Exam :
JAMB Exam
Paper 1 | Objectives
51 - 51 of 51 Questions
| # | Question | Ans |
|---|---|---|
| 51. |
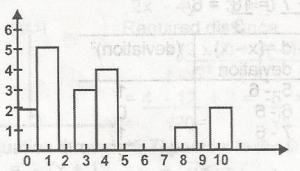 The bar chart shows the distribution of marks in a class test. How many students took the test? A. 15 B. 20 C. 25 D. 30 Detailed SolutionNumber f students that took the test = \(\sum f\). Where f is the frequencies= 2 + 5 + 0 + 3 + 4 + 0 + 0 + 2 + 3 + 1 + 2 = 20 |
| 51. |
The bar chart shows the distribution of marks in a class test. How many students took the test? A. 15 B. 20 C. 25 D. 30 Detailed SolutionNumber f students that took the test = \(\sum f\). Where f is the frequencies= 2 + 5 + 0 + 3 + 4 + 0 + 0 + 2 + 3 + 1 + 2 = 20 |