Year :
2011
Title :
Mathematics (Core)
Exam :
WASSCE/WAEC MAY/JUNE
Paper 1 | Objectives
41 - 49 of 49 Questions
| # | Question | Ans |
|---|---|---|
| 41. |
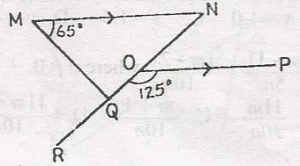 In the diagram, /MN/, /OP/, /QOP/ = 125o. What is the size of < MQR? A. 11o B. 120o C. 130o D. 160o Detailed Solution< NOP = 180 - 125 = 55o(< s on a straight line)But < NOP = < ONM (alternate < s) < ONM = 55o < M + < N + < MQN = 180o (sum of interior < s of a \(\bigtriangleup\)) i.e 65o + 55o + < MQN = 180 < MQN = 180 - 12o = 60 < MQR + < MQN = 180 (< s on straight line) < MQR + 60 = 180 < MQR + 60 = 180 < MQR = 180 - 60 = 120o |
|
| 42. |
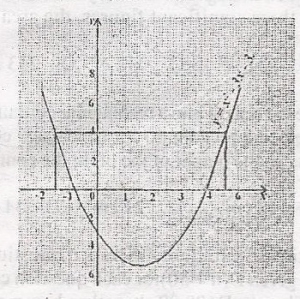 The graph represents the relation y = x\(^2\) - 3x - 3. What is the equation of the line of symmetry of the graph? A. y = 0.5 B. x = 1.0 C. x = 1.5 D. y = 4.6 |
C |
| 43. |
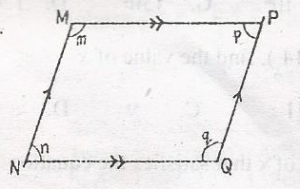 From the diagram, Which of the following statements are true? i. m = q ii. n = q iii. n + p = 180o iv. p + m = 180o A. i and iii B. i and iv C. ii and iii D. ii and ic |
A |
| 44. |
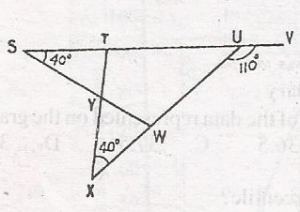 In the diagram, STUV is a straight line. < TSY = < UXY = 40o and < VUW = 110o. Calculate < TYW A. 150o B. 140o C. 130o D. 120o Detailed Solution< TUW = 110o = 180o (< s on a straight line)< TUW = 180o - 110o = 70o In \(\bigtriangleup\) XTU, < XUT + < TXU = 180o i.e. < YTS + 70o = 180 < XTU = 180 - 110o = 70o Also < YTS + < XTU = 180 (< s on a straight line) i.e. < YTS + < XTU - 180(< s on straight line) i.e. < YTS + 70o = 180 < YTS = 180 - 70 |
|
| 45. |
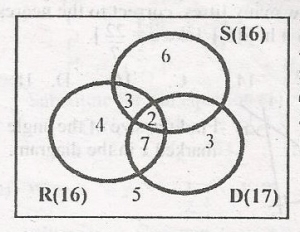 The venn diagram shows the number of students in a class who like reading(R), dancing(D) and swimming(S). How many students like dancing and swimming? A. 7 B. 9 C. 11 D. 13 Detailed Solutionstudent that like swimming = x + 2where 2 is the number of students who like reading, dancing and swimming. To find x from the venn diagram of swimming 6 +3 + 2 + x = 16 11 + x = 16 x = 16 - 11 = 5 no. of students that like dancing and swimming x + 2 = 5 + 2 = 7 |
|
| 46. |
 In the diagram /Pq//TS//TU, reflex angle QPS = 245o angle PST = 115o, , STU = 65o and < RPS = x. Find the value of x A. 80o B. 70o C. 60o D. 50o Detailed Solution< QPR = < STU = 65o (Corresponding angles)245 + < QPR = x = 360o (< s at a point) i.e. 245 + 65 + x = 360 x = 360 - (245 + 65) x = 360 - 310 x = 50o |
|
| 47. |
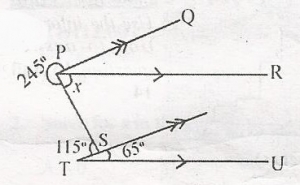 In the diagram /Pq//TS//TU, reflex angle QPS = 245o angle PST = 115o, , STU = 65o and < RPS = x. Find the value of x A. 80o B. 70o C. 60o D. 50o Detailed Solution< QPR = < STU = 65o (Corresponding angles)245 + < QPR = x = 360o (< s at a point) i.e. 245 + 65 + x = 360 x = 360 - (245 + 65) x = 50o |
|
| 48. |
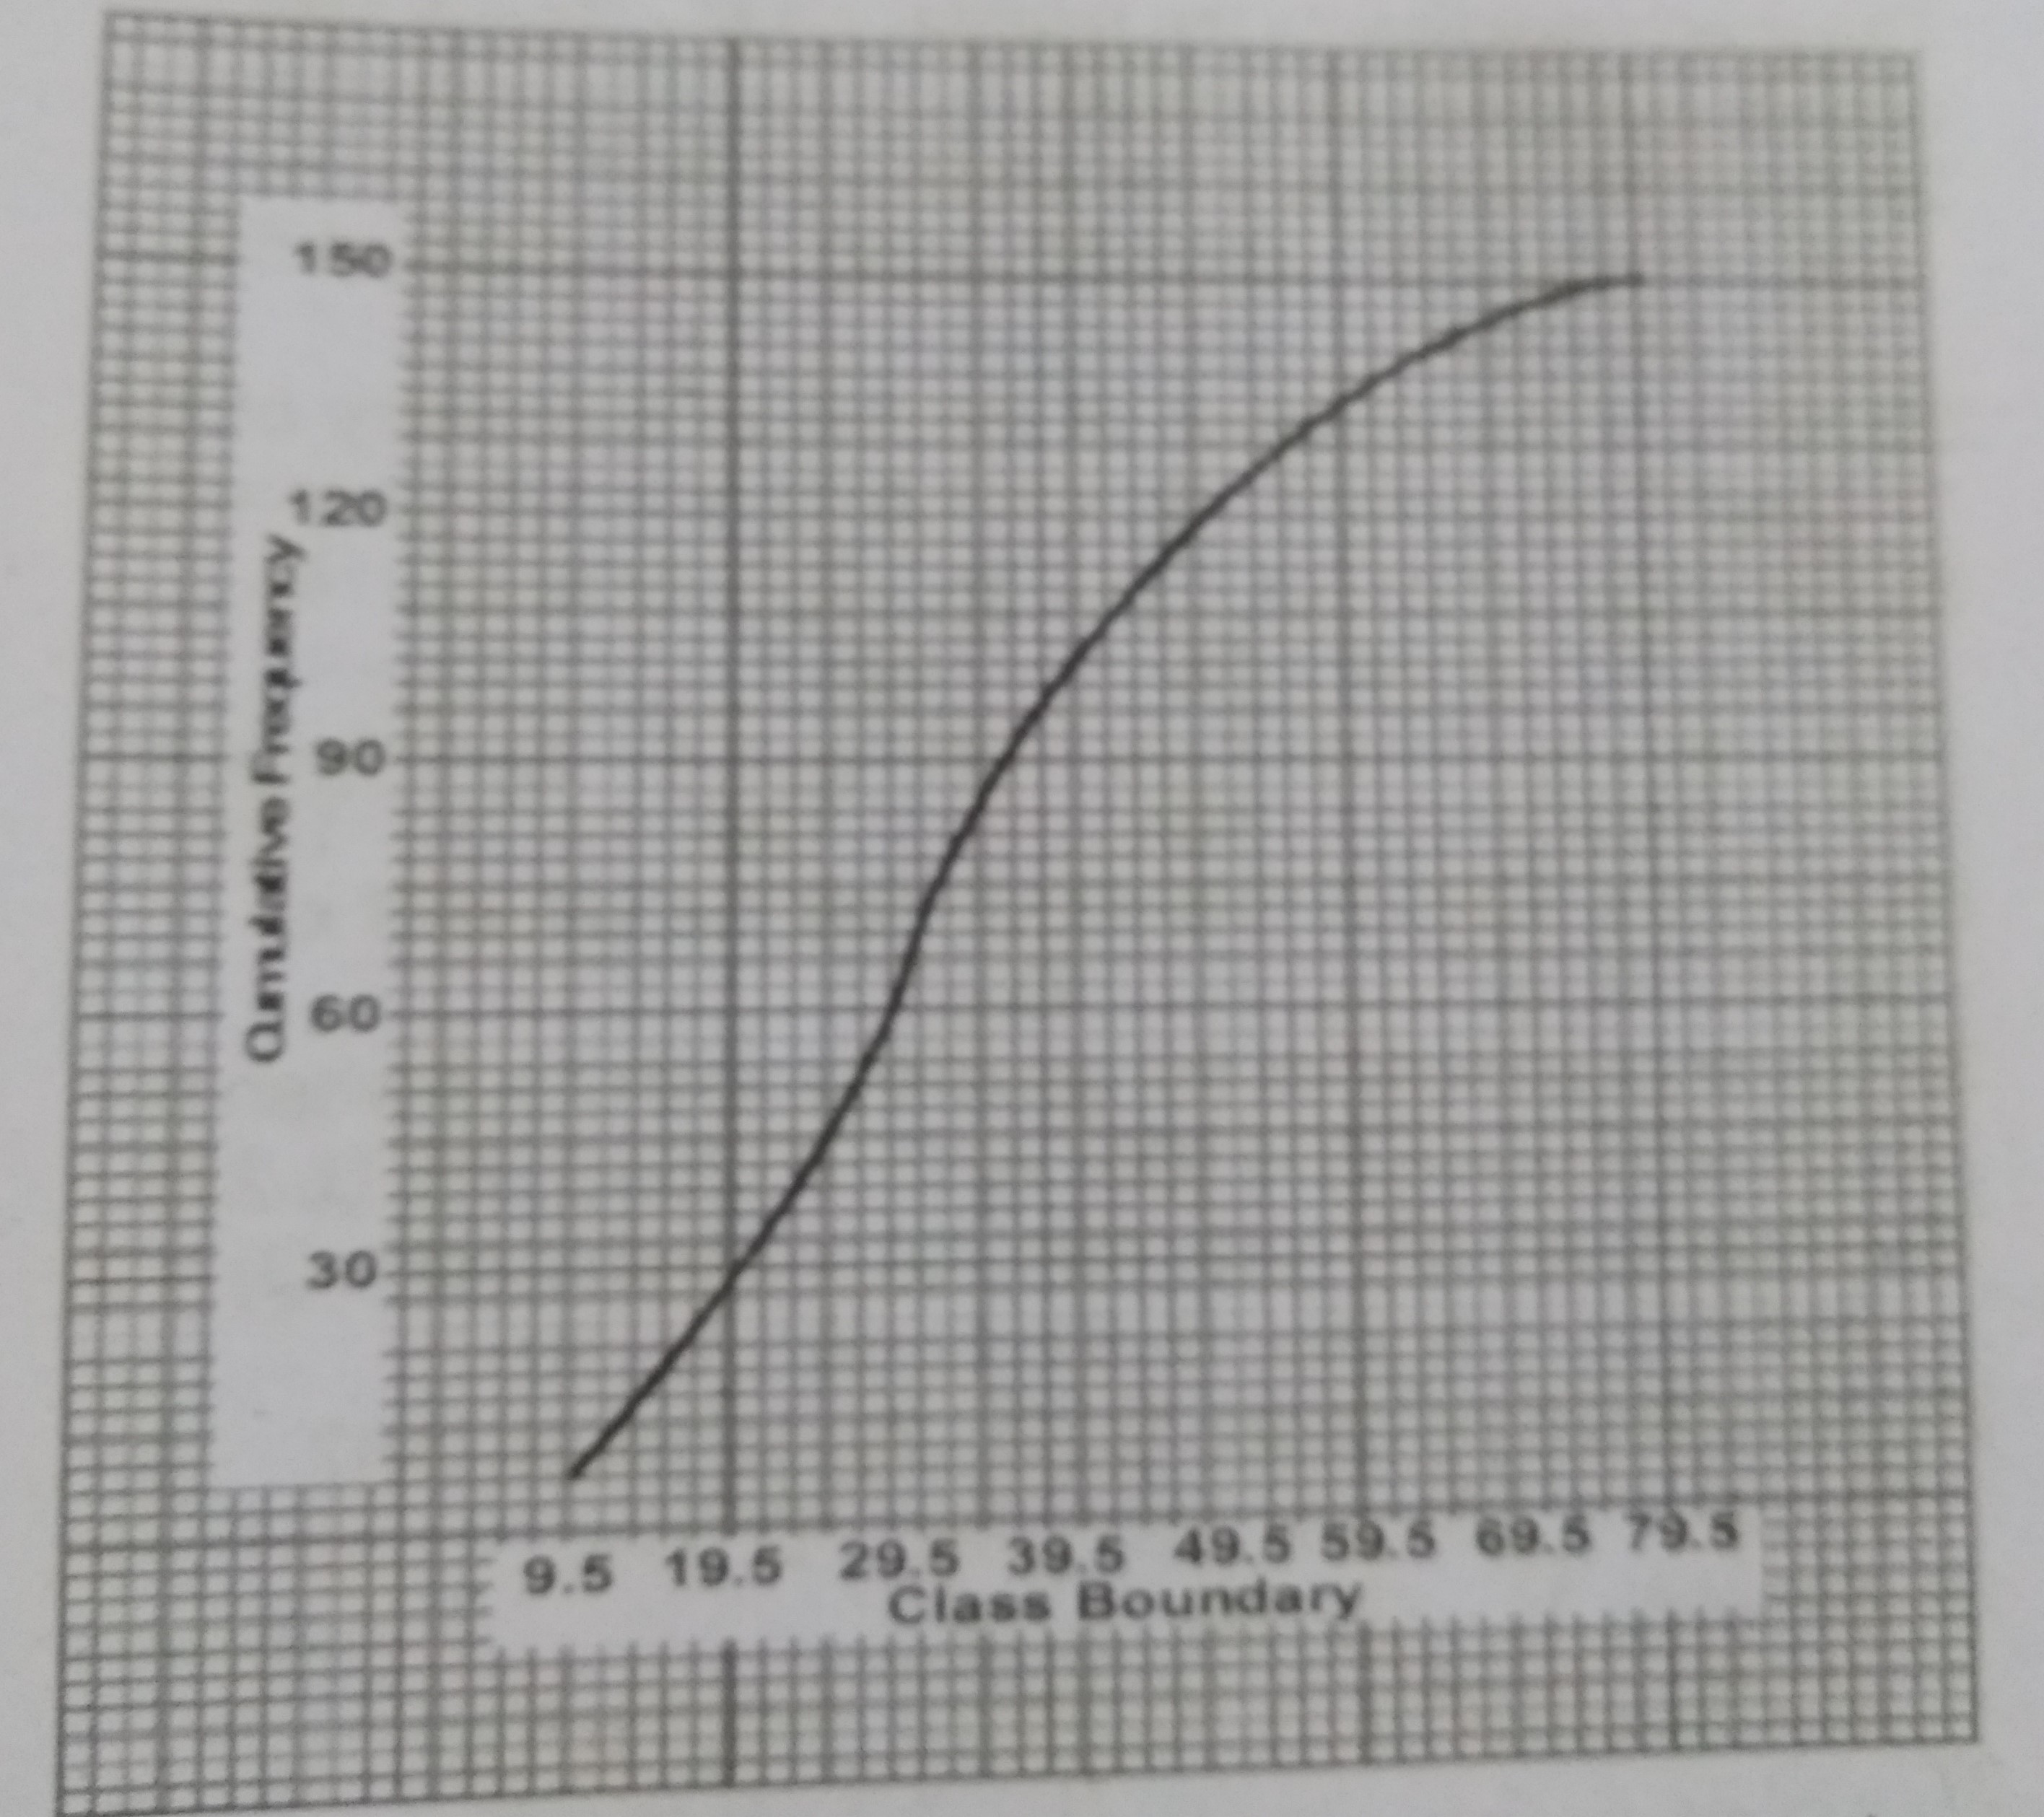 Using the cumulative frequency curve, estimate the median of the data represented on the graph. A. 35.5 B. 36.5 C. 37.5 D. 38.5 |
B |
| 49. |
 Using the cumulative frequency curve. What is the 80th percentile? A. 45.5 B. 46.5 C. 47.5 D. 48.5 |
C |
| 41. |
In the diagram, /MN/, /OP/, /QOP/ = 125o. What is the size of < MQR? A. 11o B. 120o C. 130o D. 160o Detailed Solution< NOP = 180 - 125 = 55o(< s on a straight line)But < NOP = < ONM (alternate < s) < ONM = 55o < M + < N + < MQN = 180o (sum of interior < s of a \(\bigtriangleup\)) i.e 65o + 55o + < MQN = 180 < MQN = 180 - 12o = 60 < MQR + < MQN = 180 (< s on straight line) < MQR + 60 = 180 < MQR + 60 = 180 < MQR = 180 - 60 = 120o |
|
| 42. |
The graph represents the relation y = x\(^2\) - 3x - 3. What is the equation of the line of symmetry of the graph? A. y = 0.5 B. x = 1.0 C. x = 1.5 D. y = 4.6 |
C |
| 43. |
From the diagram, Which of the following statements are true? i. m = q ii. n = q iii. n + p = 180o iv. p + m = 180o A. i and iii B. i and iv C. ii and iii D. ii and ic |
A |
| 44. |
In the diagram, STUV is a straight line. < TSY = < UXY = 40o and < VUW = 110o. Calculate < TYW A. 150o B. 140o C. 130o D. 120o Detailed Solution< TUW = 110o = 180o (< s on a straight line)< TUW = 180o - 110o = 70o In \(\bigtriangleup\) XTU, < XUT + < TXU = 180o i.e. < YTS + 70o = 180 < XTU = 180 - 110o = 70o Also < YTS + < XTU = 180 (< s on a straight line) i.e. < YTS + < XTU - 180(< s on straight line) i.e. < YTS + 70o = 180 < YTS = 180 - 70 |
|
| 45. |
The venn diagram shows the number of students in a class who like reading(R), dancing(D) and swimming(S). How many students like dancing and swimming? A. 7 B. 9 C. 11 D. 13 Detailed Solutionstudent that like swimming = x + 2where 2 is the number of students who like reading, dancing and swimming. To find x from the venn diagram of swimming 6 +3 + 2 + x = 16 11 + x = 16 x = 16 - 11 = 5 no. of students that like dancing and swimming x + 2 = 5 + 2 = 7 |
| 46. |
In the diagram /Pq//TS//TU, reflex angle QPS = 245o angle PST = 115o, , STU = 65o and < RPS = x. Find the value of x A. 80o B. 70o C. 60o D. 50o Detailed Solution< QPR = < STU = 65o (Corresponding angles)245 + < QPR = x = 360o (< s at a point) i.e. 245 + 65 + x = 360 x = 360 - (245 + 65) x = 360 - 310 x = 50o |
|
| 47. |
In the diagram /Pq//TS//TU, reflex angle QPS = 245o angle PST = 115o, , STU = 65o and < RPS = x. Find the value of x A. 80o B. 70o C. 60o D. 50o Detailed Solution< QPR = < STU = 65o (Corresponding angles)245 + < QPR = x = 360o (< s at a point) i.e. 245 + 65 + x = 360 x = 360 - (245 + 65) x = 50o |
|
| 48. |
Using the cumulative frequency curve, estimate the median of the data represented on the graph. A. 35.5 B. 36.5 C. 37.5 D. 38.5 |
B |
| 49. |
Using the cumulative frequency curve. What is the 80th percentile? A. 45.5 B. 46.5 C. 47.5 D. 48.5 |
C |