Year :
1980
Title :
Geography
Exam :
JAMB Exam
Paper 1 | Objectives
41 - 50 of 50 Questions
| # | Question | Ans |
|---|---|---|
| 41. |
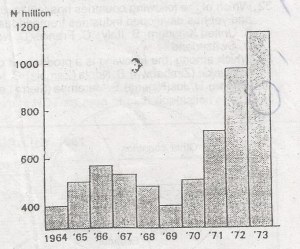 Gross capital formation in Nigeria 1964-1973, what can be inferred from the histogram above? A. there was a steady growth of capital formation in the period B. capital formation in the last two years exactly equalled those of all previous years combined C. at the end of the period, Nigeria had become self-sufficient D. Nigeria experienced serious economic problems during the period E. Nigeria is one of the richest countries in Africa |
B |
| 42. |
 Which of the following is the appropriate shape of the section from A to B? choose the correct answer from the options above A. A B. B C. C D. D E. E |
D |
| 43. |
 Identify the shaded natural region in the diagram A. Tropical monsoon B. Equatorial C. Hot desert D. Mediterranean E. Tropical savannah |
C |
| 44. |
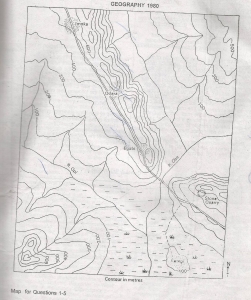 The ground distance along the river from the confluence of Rivers Obe and Opi to the bridge across River Obe is 5.5kilometres. What is the scale of the map in Representative Fraction? A. 1:10,000 B. 1:50,000 C. 1:100,000 D. 1:500,000 E. 1:1,000,000 |
E |
| 45. |
Which one of the following states of Nigeria is a major cotton producer? A. Kano B. Borno C. Bendel D. Bauchi E. Benue |
D |
| 46. |
Which of these statements is true of Africa? A. Africa is the fourth largest continent in the world B. Africa is the least urbanized continent C. Tropical Africa is so warm that nowhere within it can find snow or ice D. There are no more than ten land-locked countries in Africa E. Africa produces nearly all the world's hard-wood timber. |
B |
| 47. |
Explain the increasing importation of food to West Africa countries A. Bad soils which cannot produce enough food B. Progressive neglect of food production C. Unfavourable climates for enough food production D. Too large populations which cannot be satisfied locally E. People's love for imported foods |
B |
| 48. |
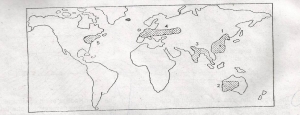 Which one of the areas shaded on the world map above is not an area of high population? A. 1 B. 2 C. 3 D. 4 E. 5 |
B |
| 49. |
Which of the following best interprets the scale "1cm represents 1km? A. 1:50 000 B. 1:300 000 C. 1:12 000 D. 1/80 000 E. 1:100 000 |
E |
| 50. |
 The climatic data shown above are for a representative station in one of the following climatic types? A. Tropical wet climate B. Mediterranean climate or sub-tropical dry summer C. Tropical wet and dry climate or savannah D. Temperate oceanic climate E. Sub-tropical steppe(semi-desert) climate |
C |
| 41. |
Gross capital formation in Nigeria 1964-1973, what can be inferred from the histogram above? A. there was a steady growth of capital formation in the period B. capital formation in the last two years exactly equalled those of all previous years combined C. at the end of the period, Nigeria had become self-sufficient D. Nigeria experienced serious economic problems during the period E. Nigeria is one of the richest countries in Africa |
B |
| 42. |
Which of the following is the appropriate shape of the section from A to B? choose the correct answer from the options above A. A B. B C. C D. D E. E |
D |
| 43. |
Identify the shaded natural region in the diagram A. Tropical monsoon B. Equatorial C. Hot desert D. Mediterranean E. Tropical savannah |
C |
| 44. |
The ground distance along the river from the confluence of Rivers Obe and Opi to the bridge across River Obe is 5.5kilometres. What is the scale of the map in Representative Fraction? A. 1:10,000 B. 1:50,000 C. 1:100,000 D. 1:500,000 E. 1:1,000,000 |
E |
| 45. |
Which one of the following states of Nigeria is a major cotton producer? A. Kano B. Borno C. Bendel D. Bauchi E. Benue |
D |
| 46. |
Which of these statements is true of Africa? A. Africa is the fourth largest continent in the world B. Africa is the least urbanized continent C. Tropical Africa is so warm that nowhere within it can find snow or ice D. There are no more than ten land-locked countries in Africa E. Africa produces nearly all the world's hard-wood timber. |
B |
| 47. |
Explain the increasing importation of food to West Africa countries A. Bad soils which cannot produce enough food B. Progressive neglect of food production C. Unfavourable climates for enough food production D. Too large populations which cannot be satisfied locally E. People's love for imported foods |
B |
| 48. |
Which one of the areas shaded on the world map above is not an area of high population? A. 1 B. 2 C. 3 D. 4 E. 5 |
B |
| 49. |
Which of the following best interprets the scale "1cm represents 1km? A. 1:50 000 B. 1:300 000 C. 1:12 000 D. 1/80 000 E. 1:100 000 |
E |
| 50. |
The climatic data shown above are for a representative station in one of the following climatic types? A. Tropical wet climate B. Mediterranean climate or sub-tropical dry summer C. Tropical wet and dry climate or savannah D. Temperate oceanic climate E. Sub-tropical steppe(semi-desert) climate |
C |