Year :
2008
Title :
Biology
Exam :
JAMB Exam
Paper 1 | Objectives
41 - 50 of 50 Questions
| # | Question | Ans |
|---|---|---|
| 41. |
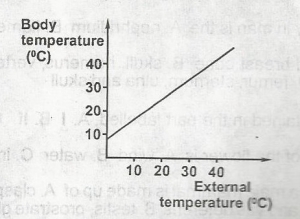 Use the diagram above to answer this question. The animal represented by l is a A. poikilotherm B. homoiotherm C. carnivore D. herbivore |
B |
| 42. |
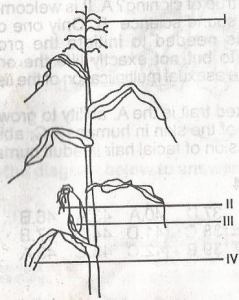 In the diagram, the illustration is a typical example of a plant pollinated by A. wind B. man C. insects D. birds |
A |
| 43. |
 In the diagram, the part labelled I represents the A. stationary phase B. lag phase C. log phase D. steady phase |
B |
| 44. |
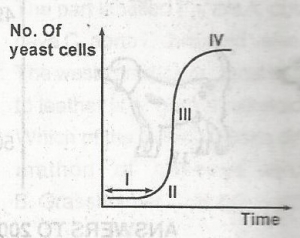 In the diagram, the part labelled IV indicated that the yeast population has A. reached its maximum size B. reached senescence C. stopped metabolizing food D. started dying |
A |
| 45. |
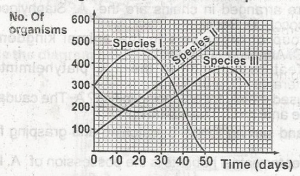 In the diagram, if species i, ii and iii interact in a community, which of the following statement is true? A. the population of species ii is growing at a slow rate B. the population of species iii has reached its carrying capscity? C. the population of species I has become extinct D. the population of species I is always |
C |
| 46. |
 In the diagram, the population size of species II on the 20th day is A. 100 B. 200 C. 300 D. 400 |
B |
| 47. |
 In the diagram, which of the four offspring of the cross will be sort if T the gene for tallness is A. i B. ii C. iii D. iv |
D |
| 48. |
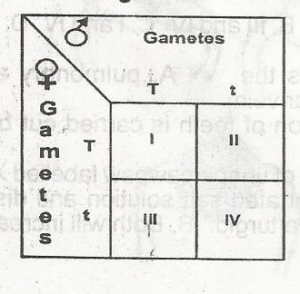 In the diagram, the genotypic ratio of the offspring of the cross is A. 1:2 B. 1:2:1 C. 1:1:1:1 D. 3:1 |
B |
| 49. |
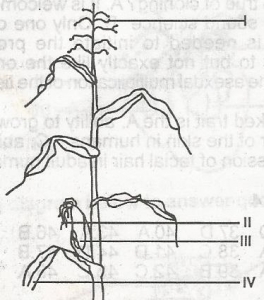 Use the diagram above to answer this question. The male inflorescence is labelled A. i B. ii C. iii D. iv |
A |
| 50. |
The natural process that produces adaptive evolutionary changes is A. Mutation B. Gene flow C. Genetic drift D. Natural selection |
D |
| 41. |
Use the diagram above to answer this question. The animal represented by l is a A. poikilotherm B. homoiotherm C. carnivore D. herbivore |
B |
| 42. |
In the diagram, the illustration is a typical example of a plant pollinated by A. wind B. man C. insects D. birds |
A |
| 43. |
In the diagram, the part labelled I represents the A. stationary phase B. lag phase C. log phase D. steady phase |
B |
| 44. |
In the diagram, the part labelled IV indicated that the yeast population has A. reached its maximum size B. reached senescence C. stopped metabolizing food D. started dying |
A |
| 45. |
In the diagram, if species i, ii and iii interact in a community, which of the following statement is true? A. the population of species ii is growing at a slow rate B. the population of species iii has reached its carrying capscity? C. the population of species I has become extinct D. the population of species I is always |
C |
| 46. |
In the diagram, the population size of species II on the 20th day is A. 100 B. 200 C. 300 D. 400 |
B |
| 47. |
In the diagram, which of the four offspring of the cross will be sort if T the gene for tallness is A. i B. ii C. iii D. iv |
D |
| 48. |
In the diagram, the genotypic ratio of the offspring of the cross is A. 1:2 B. 1:2:1 C. 1:1:1:1 D. 3:1 |
B |
| 49. |
Use the diagram above to answer this question. The male inflorescence is labelled A. i B. ii C. iii D. iv |
A |
| 50. |
The natural process that produces adaptive evolutionary changes is A. Mutation B. Gene flow C. Genetic drift D. Natural selection |
D |